On June 21, 2022 Climate Central introduced the Climate Shift Index.
"KEY CONCEPTS
Today, Climate Central launches the Climate Shift Index—a new tool that shows the local influence of climate change, every day.
Climate Shift Index (CSI) levels indicate how much climate change has altered the frequency of daily temperatures at a particular location.
Starting today, Climate Central will be updating the Climate Shift Index daily with interactive maps and 3-day CSI forecasts available for locations across the continental U.S.
Climate Shift Index levels, maps, and forecasts can now be used in real-time to help the public understand that climate change is not just about long-term trends—it’s already part of our daily lives."
https://www.climatecentral.org/climate-matters/introducing-the-climate-shift-index
======================================================================
Here is where you can go to obtain the most current Climate Shift Index (CSI) map of the United States. Your interactive options including showing the map with the HIGH or LOW temperatures, and focusing upon one of three options the CSI, the anomaly, or the actual temperature. You can download an image (or several images) to your computer for your own use.
https://www.climatecentral.org/tools/climate-shift-index
-------------------------------------------------------------------------------------------------------------------------
In their FAQ they define the CSI thus:
"The Climate Shift Index is a number that indicates the fingerprint of climate change on any day’s local weather. The initial implementation of CSI is for high and low air temperatures. A CSI level above zero means that human-caused climate change has made that day’s temperature more common (and a level below zero, less common). A CSI can be calculated for observed temperatures and for forecasted temperatures."
https://www.climatecentral.org/realtime-fingerprints
--------------------------------------------------------------------------------------------------------------------------
They also provide a detailed definition of the Climate Shift Index in this handy chart:
"The CSI is a categorical scale, with the categories defined by the ratio of how common (or likely) a temperature is in today’s altered climate vs. how common it would be in a climate without human-caused climate change. For the positive CSI conditions (which occur much more often than the negative), we assigned a simple descriptor to these events (see table)."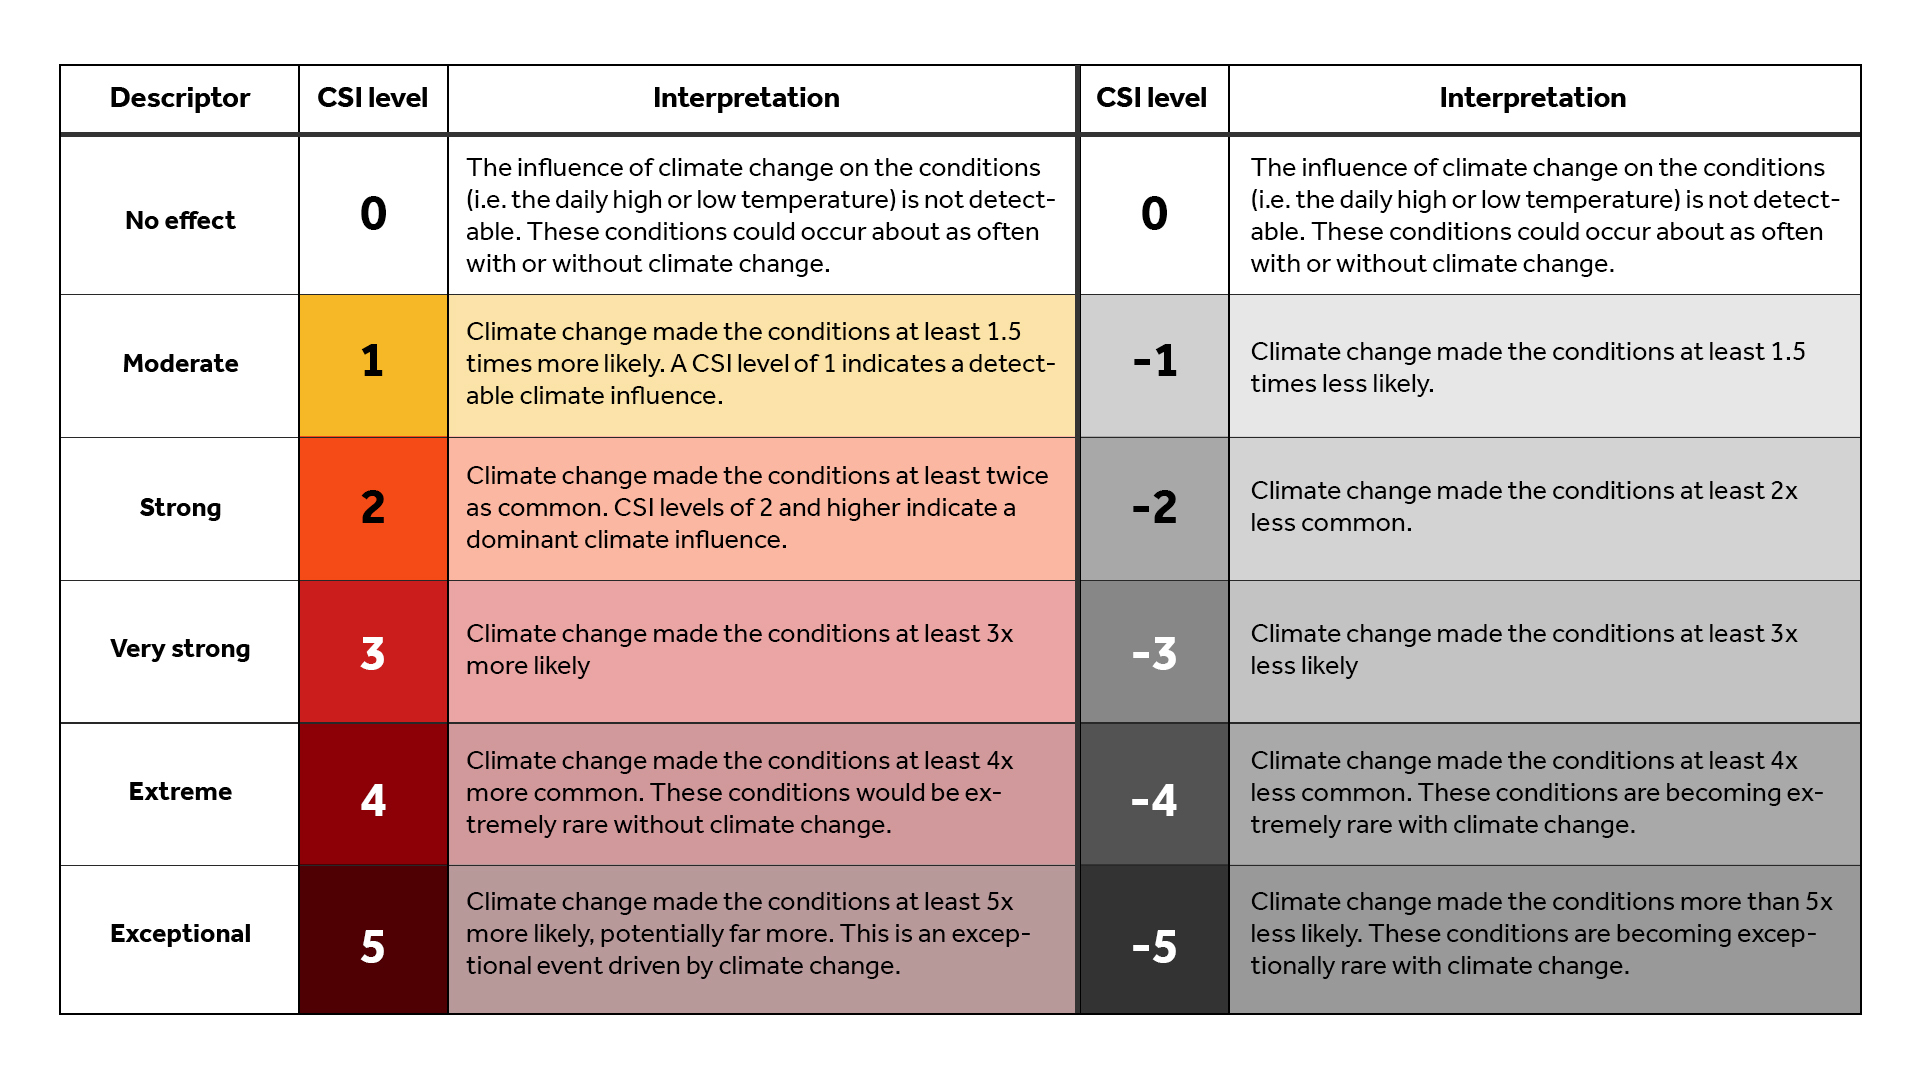
https://www.climatecentral.org/realtime-fingerprints
--------------------------------------------------------------------------------------------------------------------
Going forward I can see how this will provide individuals with another tool that will be useful in conveying one of the more subtle concepts of climate change.
No comments:
Post a Comment